coSMicQC: A step toward quality control and improvement of morphology profiles
Let’s tour the single-cell morphological galaxy with coSMicQC!
Hi everyone! 🤩
I’m back with another blog post! This time, I want to share something I’ve become very excited and passionate about:
✨ Quality control of single-cell morphology profiles ✨
I will go over what is quality control for morphology profiles, existing work on this topic, the software (coSMicQC) that we have developed to help in this area, and where we hope to go from here.
Contents
- 📋 What is quality control for single-cell morphology profiles?
- 📉 What are the current methods for addressing this topic?
- 🌌 Introduction to coSMicQC
- 🎯 Example of coSMicQC’s impact
- 🚀 Where do we go from here?
Defining quality control of single cell morphology profiles
Quality Control (QC)
The process of validating and enforcing a specific standard across all products.
Single-cell morphology profiles
Features (e.g., area, texture, intensity, etc.) extracted from images of cells. Traditionally, profiles are formatted in a dataframe where each row is single-cell, and columns are either metadata or feature extracted from a specific segmented part of a cell (e.g., nucleus, whole cell, or cytoplasm).
Putting these two definitions together, single-cell quality control is the process of enforcing a standard quality based on single-cell morphology features, which we measure based on segmentation.
Background on image-based profiling
If you are unfamiliar to the standard process of image-based profiling, there are typically 3 main steps after collecting raw images:

The software called CellProfiler typically extracts morphology features from images. There are other feature extraction software (like Molecular Devices IN Carta), but we will be focusing on CellProfiler in this blog post. Researchers use CellProfiler to perform the first steps of a standard image-based analysis workflow, such as illumination correction, segmentation (traditionally of nuclei, cells, and cytoplasm), and feature extraction.
PLUG TIME! If you aren’t familiar with illumination correction (IC) or want to learn more, feel free to read the two blog posts on the topic, “Illumination Correction Made Easier” and “Steps for Performing Illumination Correction in Microscopy Images”. I also wrote a blog post regarding the pros and cons of two segmentation methods if you are interested called “Segmentation Software Usability and Performance: Part I”. OKAY, PLUG TIME OVER!
The next step in the workflow is CytoTable, which reformats the output from CellProfiler (and other feature extraction software), to create a standardized parquet file where each row is a single-cell and the columns are the combined features per cell.
Lastly, researchers preprocess the standardized output before performing analysis and machine learning. Researchers will then aggregate single-cell features to the well-level population, either by taking the median or mean. This process can be done within a software called, pycytominer, which is optimized to process morphological profiles from multiple outputs.
Aggregation removes the heterogeneity of the population and reduces noise. But, this “reduction of noise” is a bit fishy to me. 🐟 If you aggregate a bunch of poorly segmented single-cell profiles, then aggregating will just exacerbate the issue and mis-represent the biology of the population. This leads me into why I think quality control at the single-cell level for morphology profiles is a necessary step, regardless of if you plan to process your data as bulk (aggregated) or single cells.
Why single-cell quality control?
Quality control of single-cell profiles is very important to avoid mis-interpretation of the results, and ensure that downstream analysis is picking up biologically relevant information.
Imagine you have an picture of cells and you want to cut out each individual cell. As you are cutting, your hand could end up slipping or you get distracted, so your individual cell cut-out ends up missing part of the cell. This is what a segmentation error is. These cut-outs with incomplete cells are missing vital and biological information about that cell. Quality control acts like a checklist, ensuring that each cut-out meets the required standards, such as verifying that no parts of the cell are missing.
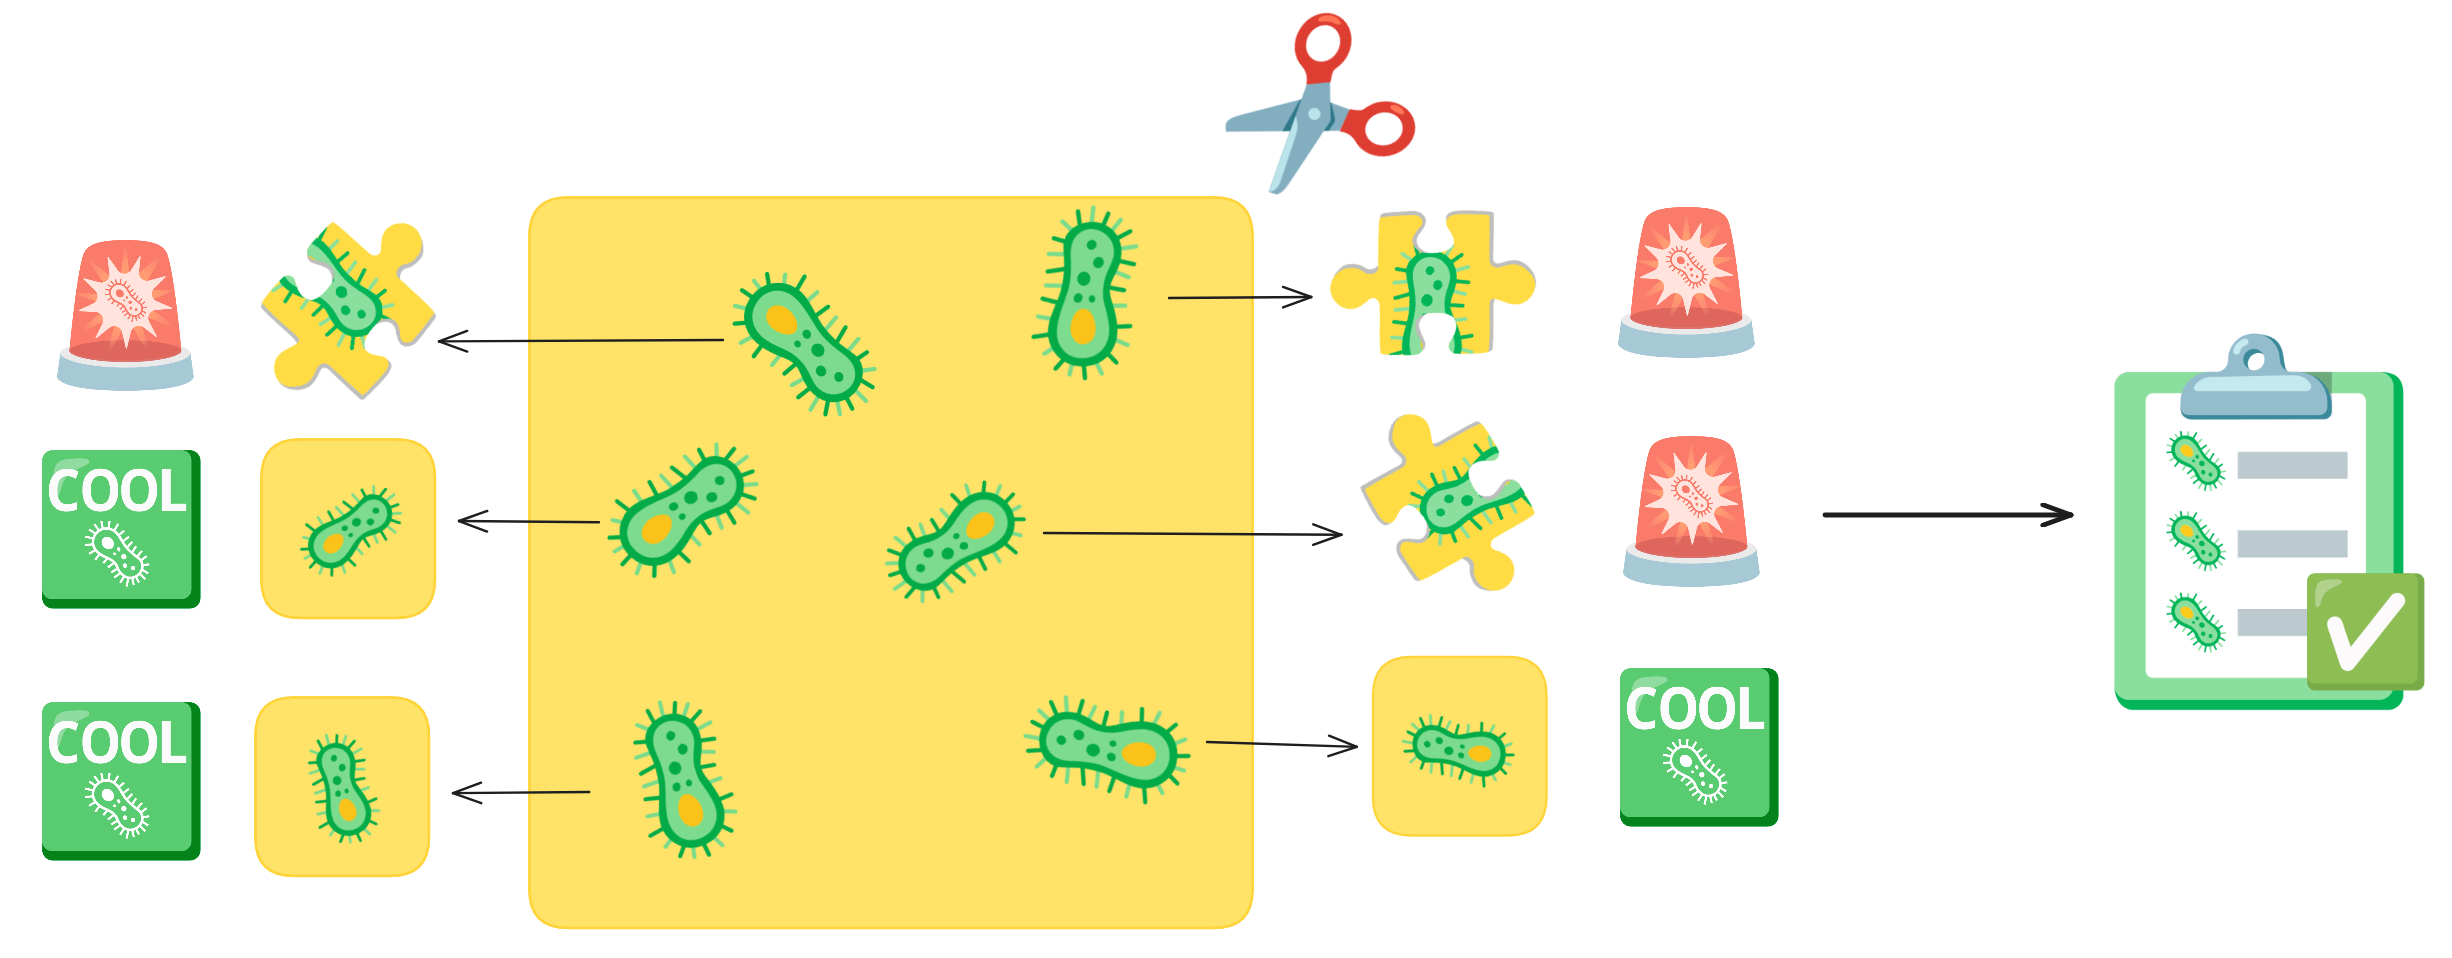
In the Way Lab, we traditionally process single-cell data, so we expect heterogeneity within our samples. We do not want the heterogeneity influenced by technical factors, like poor segmentations. So, we want to remove any of these poor segmentation before we perform important pre-processing steps like normalization and feature selection. If we don’t filter poor segmentations, our data processing will include errors, which will reduce the signal-to-noise ratio.
Therefore, we perform quality control for single-cell morphology profiles after CytoTable but before pycytominer. But, what methodology exists so that we can perform this task?
What quality control methods currently exist?
If you are familiar with the RNA-seq world, you will know that the concept of Single-cell quality control itself is not new. It is a well known process within scRNA-seq pipelines where individual cells are filtered out using a metric(s) that detects if it is likely an artifact or contains noise. It is such a well-established part of this field that there even is a whole website detected to scRNA tools, where you can filter for specifically quality control tools. This provides at least one hundred different options to try! 👀 This is also an important step in not just single-cell, but also bulk RNA-seq as well, which has existed for over two decades. scRNA-seq has been around for over a decade, so there has been a lot of time to develop these methods across both technologies.
Cell Painting was first developed in 2013, meaning that image-based profiling and extraction of morphological profiles is a new field, but it still has been around for over a decade. However, single-cell quality control for morphology profiling is not nearly as thoroughly developed. 😢
This lack of development could be because of the lack of trust in this method, which is described in the 2017 paper, “Data-analysis strategies for image-based cell profiling”. Caicedo et al. describes some general methods of cell-level outlier detection, including model-free and model-based. Their main concern is that this method of quality control can assume homogeneity and remove interesting phenotypes (spoiler, we do run into this issue!). This is why most labs skip this step. Honestly, this concern applies to all quality control methods and underscores the importance of striving for continuous improvement.
Currently, you are able to “filter objects” (e.g., segmented organelles like nuclei and cytoplasm) in CellProfiler using morphology measurements in its own module. You can set limits for what feature measurement is considered good or bad, but without exporting the data and exploring the feature space, you do not know the range of feature measurements for your dataset. In my opinion, this module is good to have, but it isn’t a solution to single-cell quality control.
I checked to see if there were existing single-cell quality control methods for image-based profiling. I was only able to find one paper, published in BMC Bioinformatics, called “A cell-level quality control workflow for high-throughput image analysis”, and it was published in 2020. It was an interesting read!
For example, in the background section, Qiu et al. state:
“To our knowledge, this represents the first QC method and scoring metric that operate at the cell level.”
Since I couldn’t find any other paper that focuses on quality control at the single-cell level published before, I completely agree with their statement, they are definitely the first.
I actually did come across another paper after this one (published in 2022) that cites their work, called “Image-based cell profiling enhancement via data cleaning methods” The main highlight in this paper, is that they did attempt cell-level outlier detection. Specifically, Rezvani et al. used a method called Histogram-Based Outlier Score (HBOS). They utilized the function from a Python package called PyOD, a well-established package dedicated to anomaly detection. Unfortunately, this paper does not include any link to reproducible code for how they used this method to detect outliers with CellProfiler features. But, they made a very promising statement:
“It turns out that the cell outlier detection is a more effective method in improving the overall profile quality, while regress-out mainly improves the very top connections.”
Given this claim, we can use this to further fuel the push towards improving single cell quality control. Unfortunately, this means there are only two papers that are performing this process, so we still have a ways to go. ⏰
But, let’s get back to the first attempt at single cell quality control (Qiu et al. 2020), shall we?
To summarize the paper, they present a cell-level quality control workflow which uses machine learning to detect artifacts within images.
They utilized CellProfiler to segment single cells and extract features from both the cells and whole images.
They wanted to group images based on their phenotype, so they utilized CellProfiler features (like PowerLogLogSlope, FocusScore, MeanIntensity, Cell Count, etc.) to detect images that contains artifacts versus no artifacts.
Once images were grouped together, they performed a method using kernel density estimate (KDE) to sample the images into their respective phenotypes.
They then trained an SVM (Support Vector Machine) per phenotype group, to classify regions in images where there are artifacts and where there are cells.
This is only a brief summary, so feel free to read the paper if you want a more in-depth look.
What I really liked about this paper is that it is attempting to preserve images that include artifacts, as these images still contain other cells. It is different than the current process where whole images are removed that fail QC metrics like blur and over-saturation (traditionally done in CellProfiler).
But, I also have my suspicions about using cells that come from an image with corruption, such as an artifact. I wonder how much things like an artifact or smudge could be directly impacting the biology the cells. 🤔 This would be a cool research project, but, in my opinion, I would rather lose cells in an image with an artifact than risk any issues in downstream interpretation of the results that might be due to any impacts the artifacts in the image had.
I have two main concerns from this paper, specifically for it’s generalizability and usability in my own pipelines:
- It was not clear to me how this method is filtering out artifacts at the single-cell level. From what I understood from the figures, the SVM is able to detect where there is artifacts and where there are cells, but I didn’t see where in their pipeline that they remove single-cells from the CellProfiler output. This is a big concern for generalizability as it seems like you would need to train SVMs on your data to be able to apply this method but there isn’t a direct link to that output and how they actually filtered cells.
- The code is available via FigShare, but it was a bit hard to parse. Since it is not on GitHub, that also limits the usability since there isn’t an environment or dependencies, and there isn’t a way to create issues and contact the maintainers for assistance. As well, I found that the code was not easy to understand and lacked documentation. I want to make clear, I appreciate that they made the code available and open source which is more than some other papers! My main point is that I don’t think this method is feasible to include in my standard workflow.
In conclusion, I want to thank the authors of this paper for their hard work and their important contributions to pushing the field towards developing quality control methodology at the single-cell level for morphology profiles.
After the research I conducted and papers I found, I was determined to pursue working on a new methodology, one that is simple, to filter out poor quality segmentations from single-cell morphology profiles.
Introduction to coSMicQC
After 2 and half years of being in my position and performing image-based profiling, I have come to realize that I am not perfect (shocking I know! 😱). No matter how much I try to manually optimize my segmentation parameters in CellProfiler or when using Cellpose or Stardist, it will not work for all of the single cells in my datasets. Now, I am not necessarily saying this is a fault of my own 😉, but segmentation errors are a persistent issue and it is currently a problem that hasn’t been solved to this day.
My point is, you can expect all of your datasets to contain some poorly segmented cells that can be described as technical artifacts. You can also expect that debris or smudges could also end up being mis-segmented as cells. When working with single-cell data, we do not want these technical artifacts impacting the interpretation of our results. Thus, was born this simple idea in my head.
Why not just filter out single cells based on the extracted morphology features?
You wouldn’t need to train any model or perform any other pipeline. You already have the data in your lap to use, but how you use that data is what is important. As Caicedo et al. points out, not all features have a normal distribution. So, we propose a solution to this that focuses on morphology features that are most directly linked to features most correlated to poor segmentation or technical artifacts.
Arriving to the stage is: drum roll please 🥁
coSMicQC, or Single cell Morphology Quality Control!

I want to shout out Dave Bunten (aka @d33bs) here, who has been a major contributor to coSMicQC, which is an open-source software that we are developing with sustainable software development practices! 📣
In summary, coSMicQC uses extracted morphology features directly from CellProfiler, performs normalization of specific features that are most related to detecting poor segmentation, and uses standard deviation to identify single cells that are considered technical outliers.
Going into more detail on this new method, it works by first creating conditions. A condition is a feature or group of features that will capture a specific type of technical artifact. For example, nuclei area and intensity can work together as a condition to detect large nuclei with high intensity which represents segmentation of clustered/overlapping nuclei. Your condition will also need how many standard deviations from the mean that you expect these outliers to be located. If you want to detect cells above a mean, you use a positive value, and vice versa for cells below the mean.
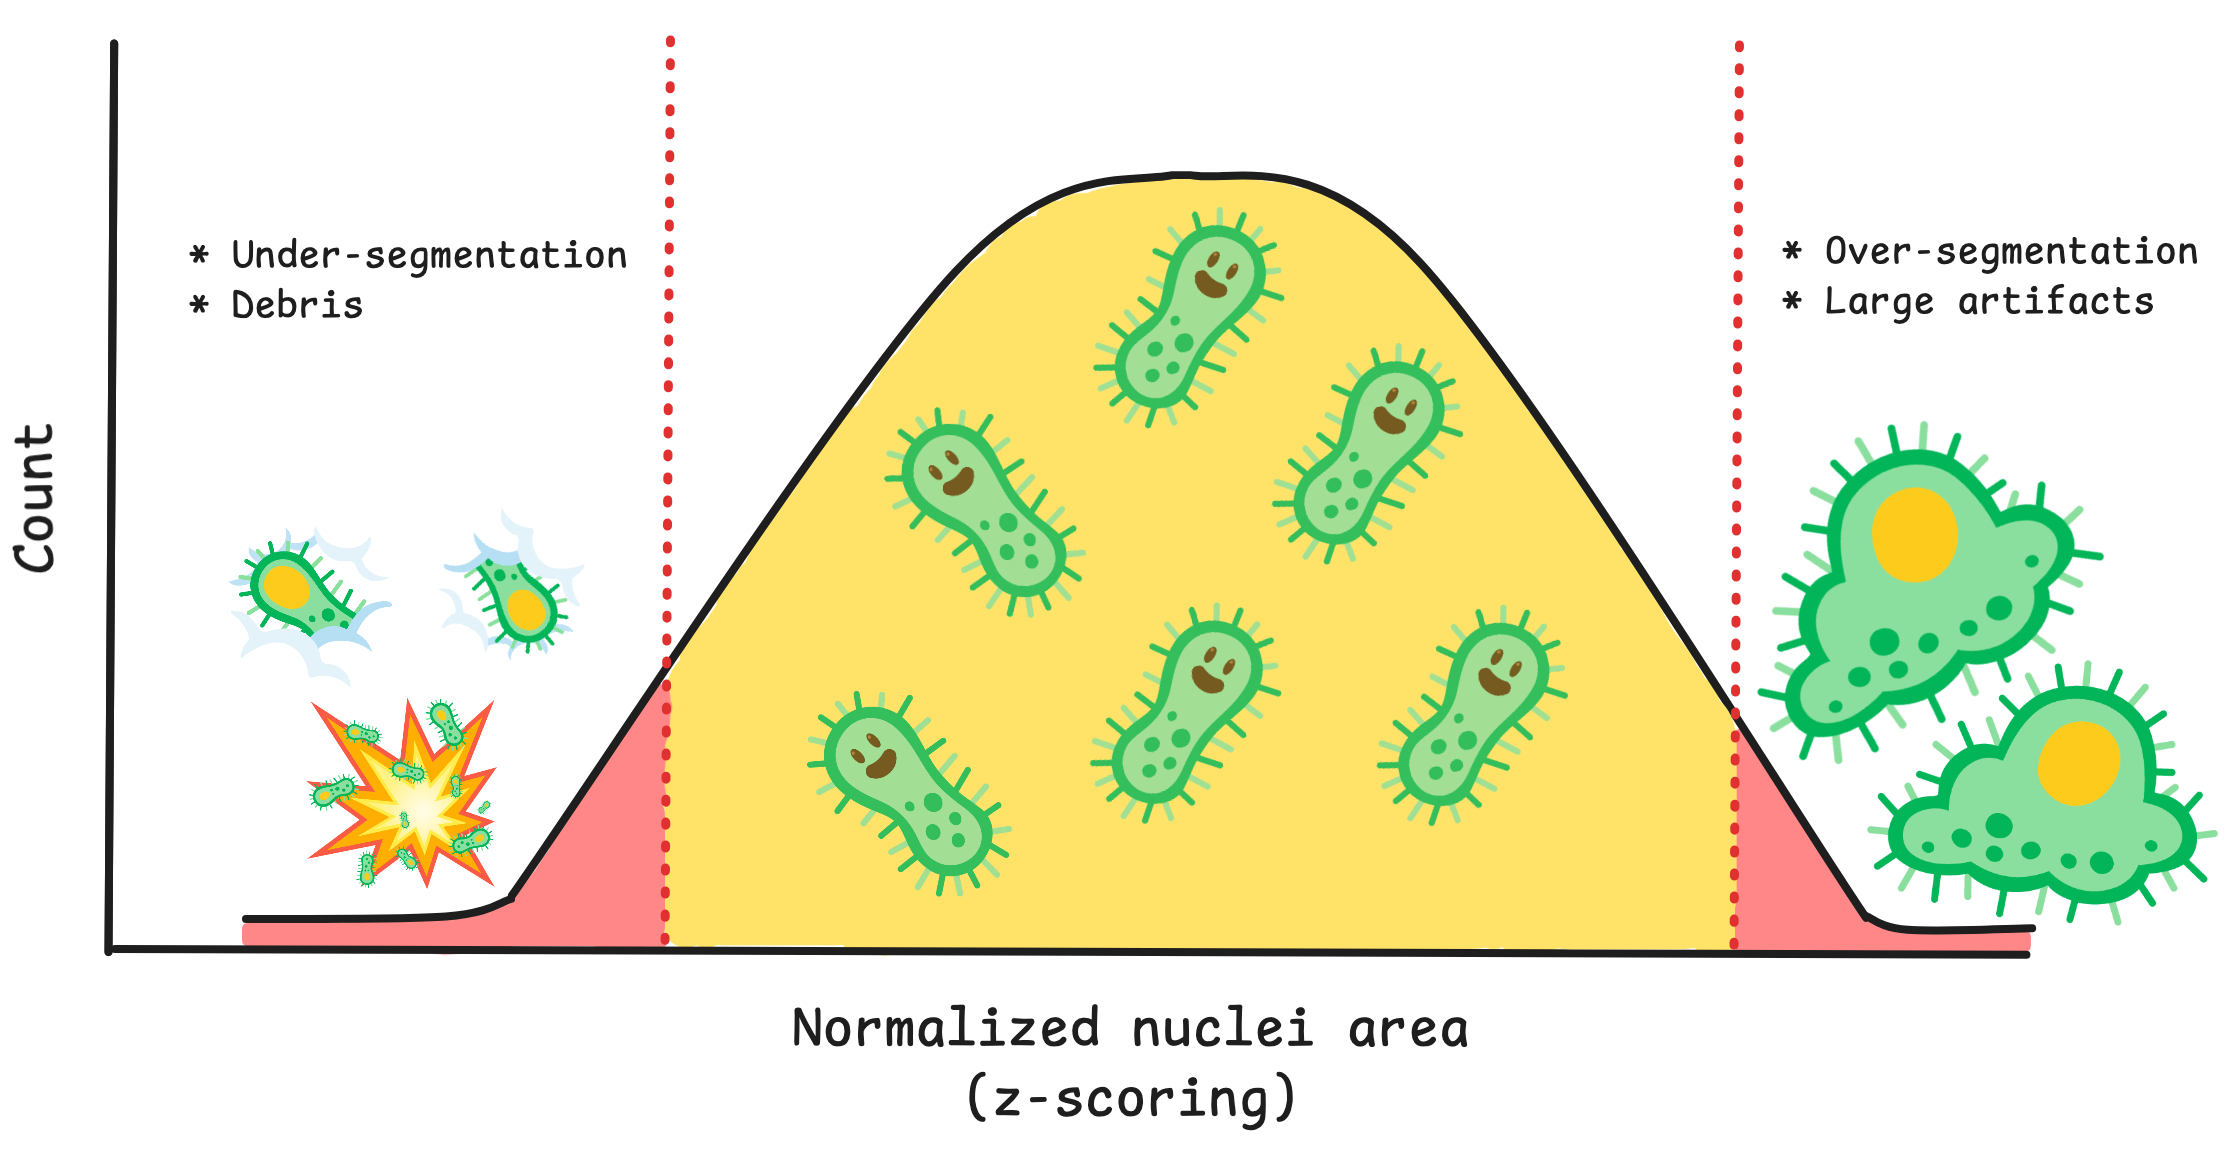
You can use the function find_outliers() to the simple conditions and voila, coSMicQC yields a dataframe with flagged single-cell outliers per condition.
A summary is also outputted, which includes the total number of outliers detected, the percent of the total cells in the data detected as outliers, and the range of the values of the outliers for the features used in the condition.
A highlight of coSMicQC is that you are able to visualize single-cell segmentations within the notebook if you provide the original images and exported outlines from CellProfiler, through the use of a novel dataframe format, built on top of pandas, that we call CytoDataFrame.
This open-source formatter is also developed by Dave Bunten! 📣
This makes it more streamlined to assess if your conditions are working without having to go outside of the notebook and jump to your handy file manager, Fiji, or CellProfiler to see what the segmented cells look like.
This feature is still being developed as we find more datasets with varying conditions for image file structure.
By detecting technical outliers with coSMicQC, further downstream processes should yield higher quality results. We have been able to test this hypothesis using one of our projects, and further prove that there is merit to pursing single-cell quality control.
Example of coSMicQC impact
Collaborators from the McKinsey lab at CU Anschutz collected, plated, and imaged cardiac fibroblasts from tissue of both heart failure patients and organ donors without heart failure using a modified Cell Painting assay. We performed an image-based profiling workflow to segment and extract single-cell morphology features. We trained a logistic regression binary classifier to predict if a single-cell comes from a failing or non-failing heart.
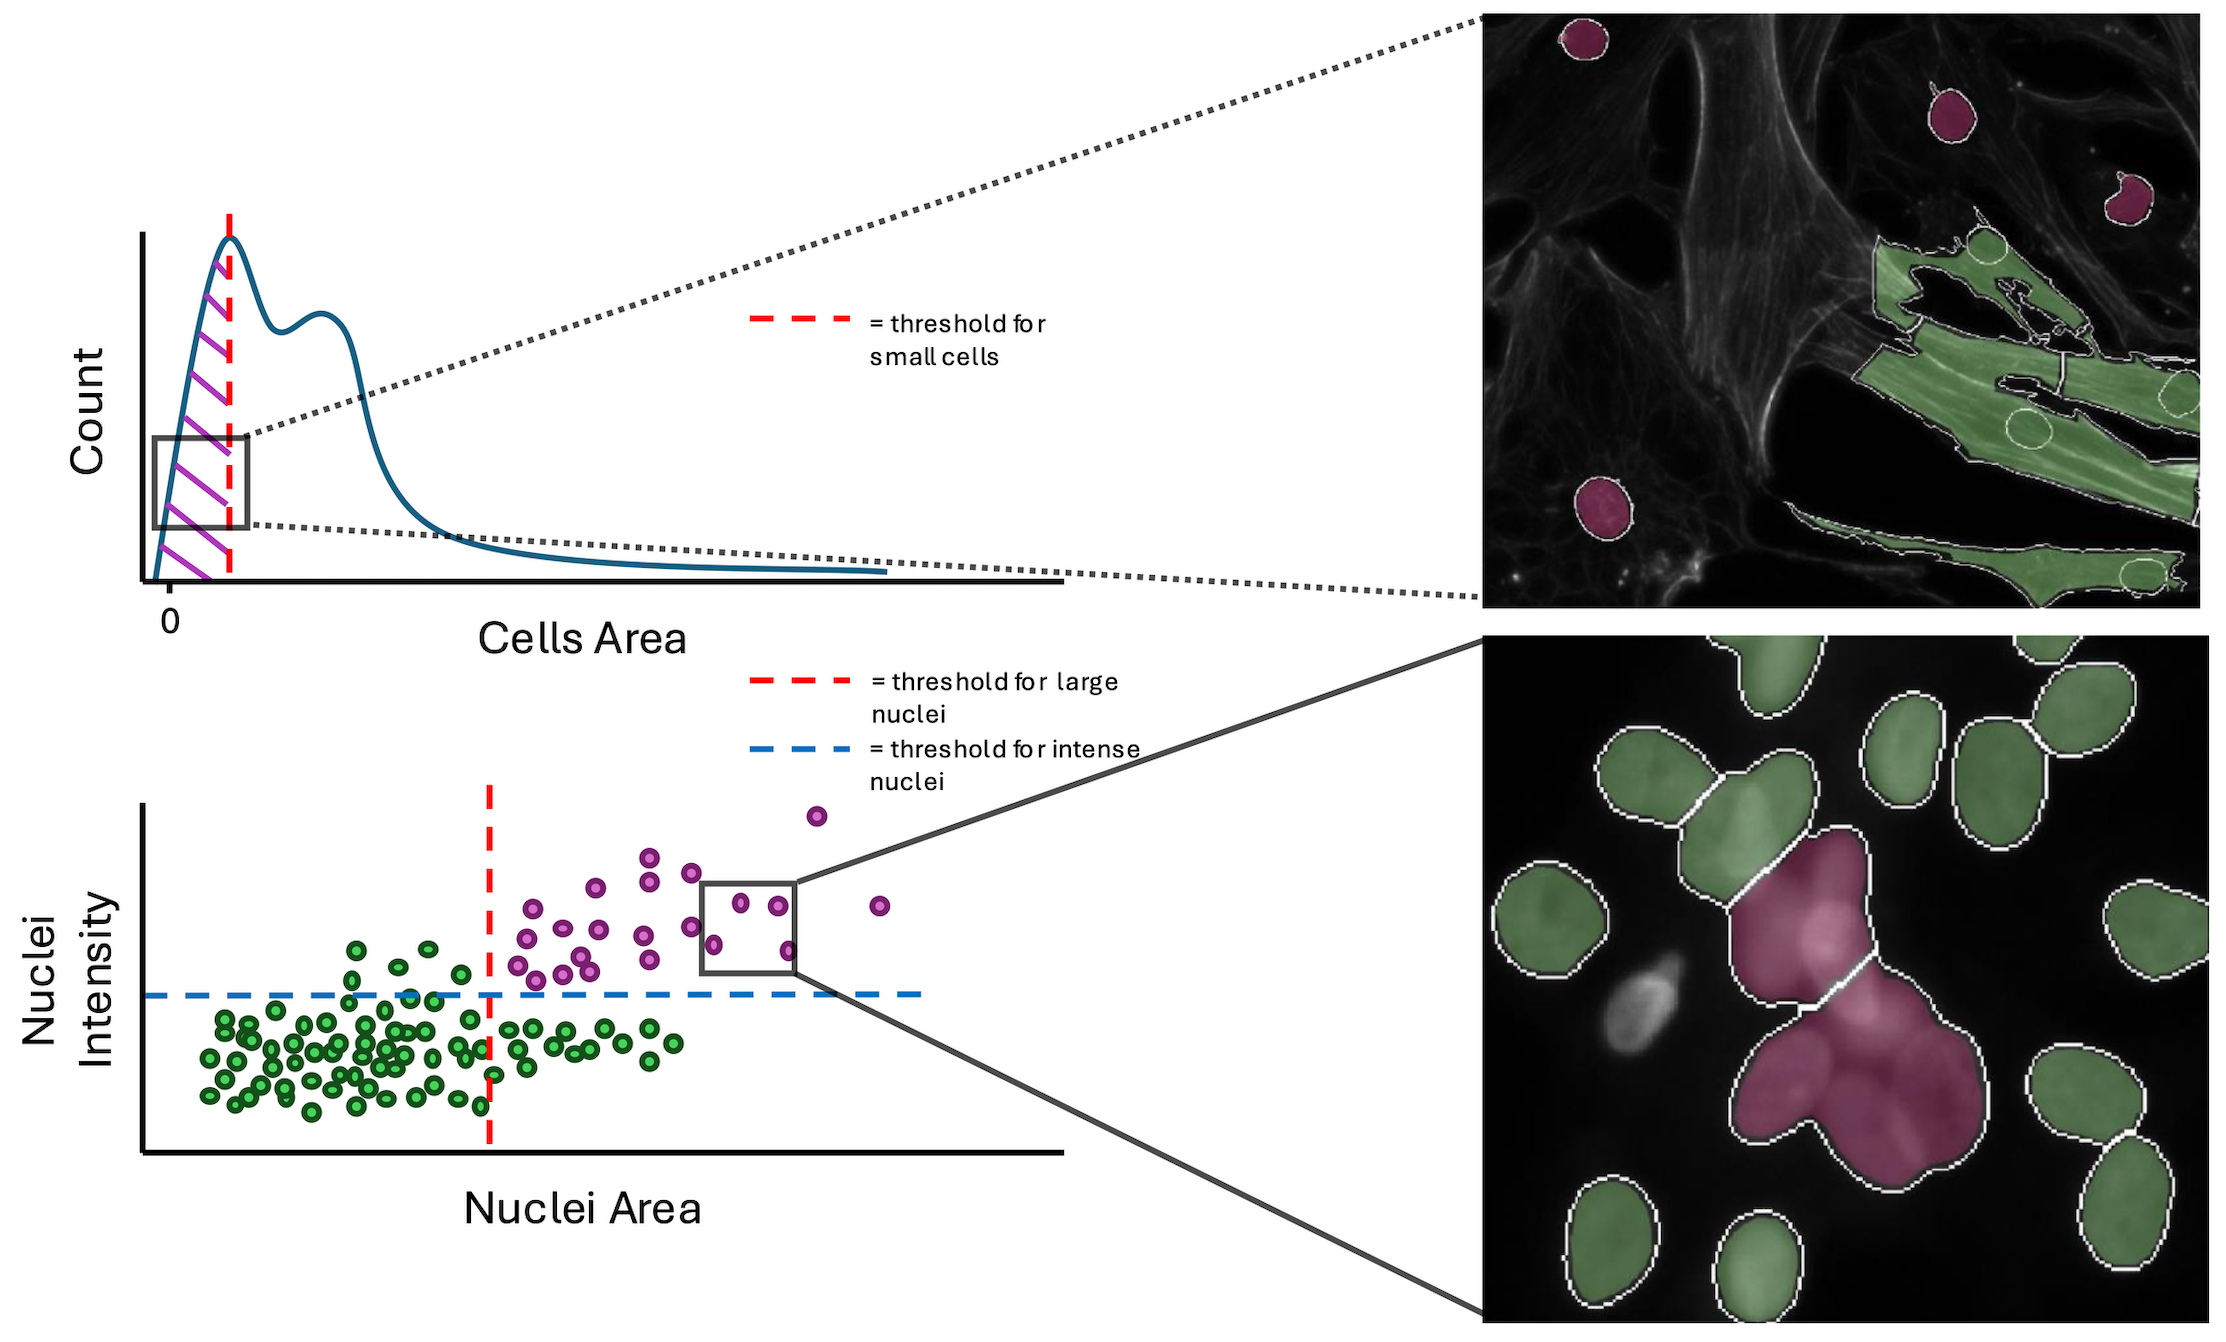
Within the workflow, we performed single-cell quality control to clean the data using coSMicQC. One of the biggest problems in this dataset is the high confluence, which occurs due to excessive cell proliferation. This leads to very clustered nuclei and higher intensity of the cells across organelles within the clusters compared to the peripheral cells. We created two “conditions” to find these poor segmentation: cells area to find abnormally small cells and large nuclei area and high nuclei intensity to detect over-segmented nuclei clusters.
To evaluate if single-cell quality control is important to training a high quality model, we perform a bootstrapping analysis using holdout data (e.g., data that the model never saw during training). We trained a new model with the same parameters, but using non-quality controlled training data. There are two holdout datasets to evaluate, one that has had QC performed on the data and another without. We will apply the models to their respective datasets, e.g., QC model with QC holdout data and no QC model with no QC holdout data.
We then perform what is called bootstrapping, where sub-samples of the data are taken to collect 1,000 different datasets of the same size as the original dataset. This means that it will randomly take single cells from the data (sometimes repeated) to create a new population, which represents what we can expect in real-life. We then calculate the ROC AUC metric, or Receiver Operating Characteristic Area Under the Curve. To be specific, this is measuring the area under the curve for the ROC, which is a plot that shows the trade off between the true positive rate and false positive rate, where a good classifier will have an area under the curve closer to 1 and bad classifier will be closer to 0. We measure the ROC AUC for all 1,000 subsample to create a distribution, which we then plot as a histogram. The mean of the distributions are represented as dashed lines.
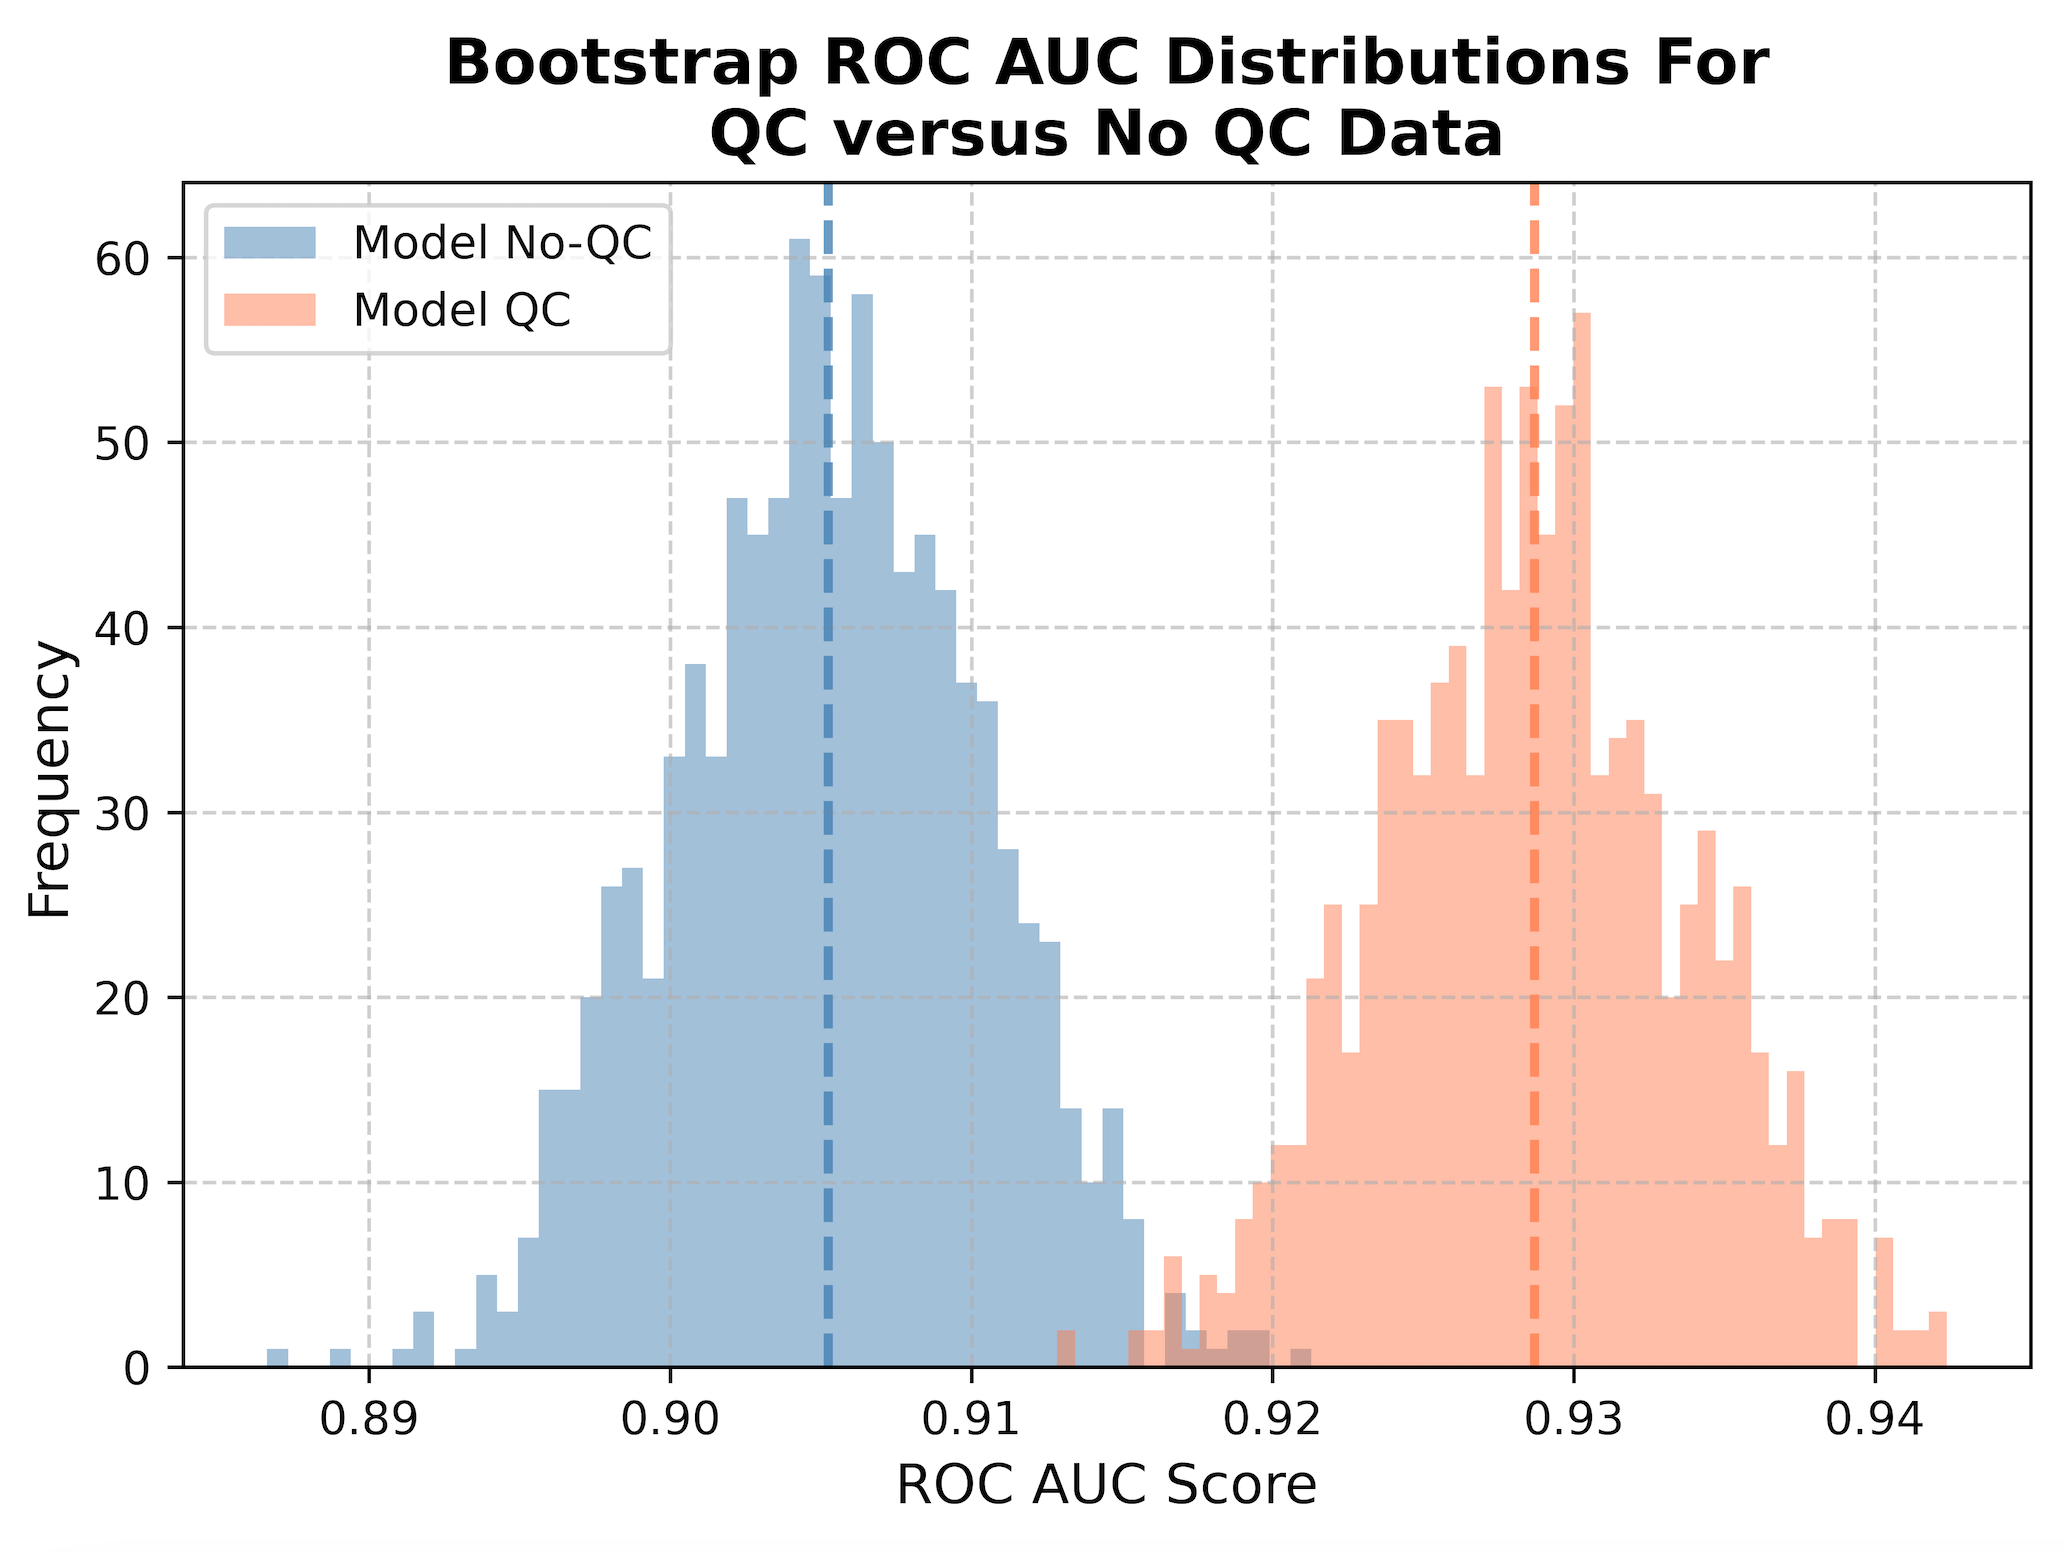
When we apply QC to our data (orange), we show a statistically significant improvement in performance at classification (t-stat = -103.7, p-value = 0.0) compared to not applying QC at all (blue). By removing poor quality segmentation, we reduce the noise in the data and significantly improve the performance of our model when applied to new data (increased generalizability).
The implementation of coSMicQC was very simple for this project. The hardest part was picking which features to use as conditions. It only takes less than a minute to run coSMicQC in a notebook to detect outliers and save the cleaned data. This project is the first of hopefully many examples where we can show the importance of single-cell quality control!
What’s next?
We have already implemented this multiple other projects! Now, I am not going to sit here writing this blog and pretend like coSMicQC works without any fault. I want to be very clear, this method is very good when applying it to cells without perturbation (e.g., happy, normal cells). We applying coSMicQC to a dataset where there are cells treated with many different perturbations, we saw that nuclei with very interesting phenotypes ended up failing quality control (red) at a higher rate than those that looked more normal.
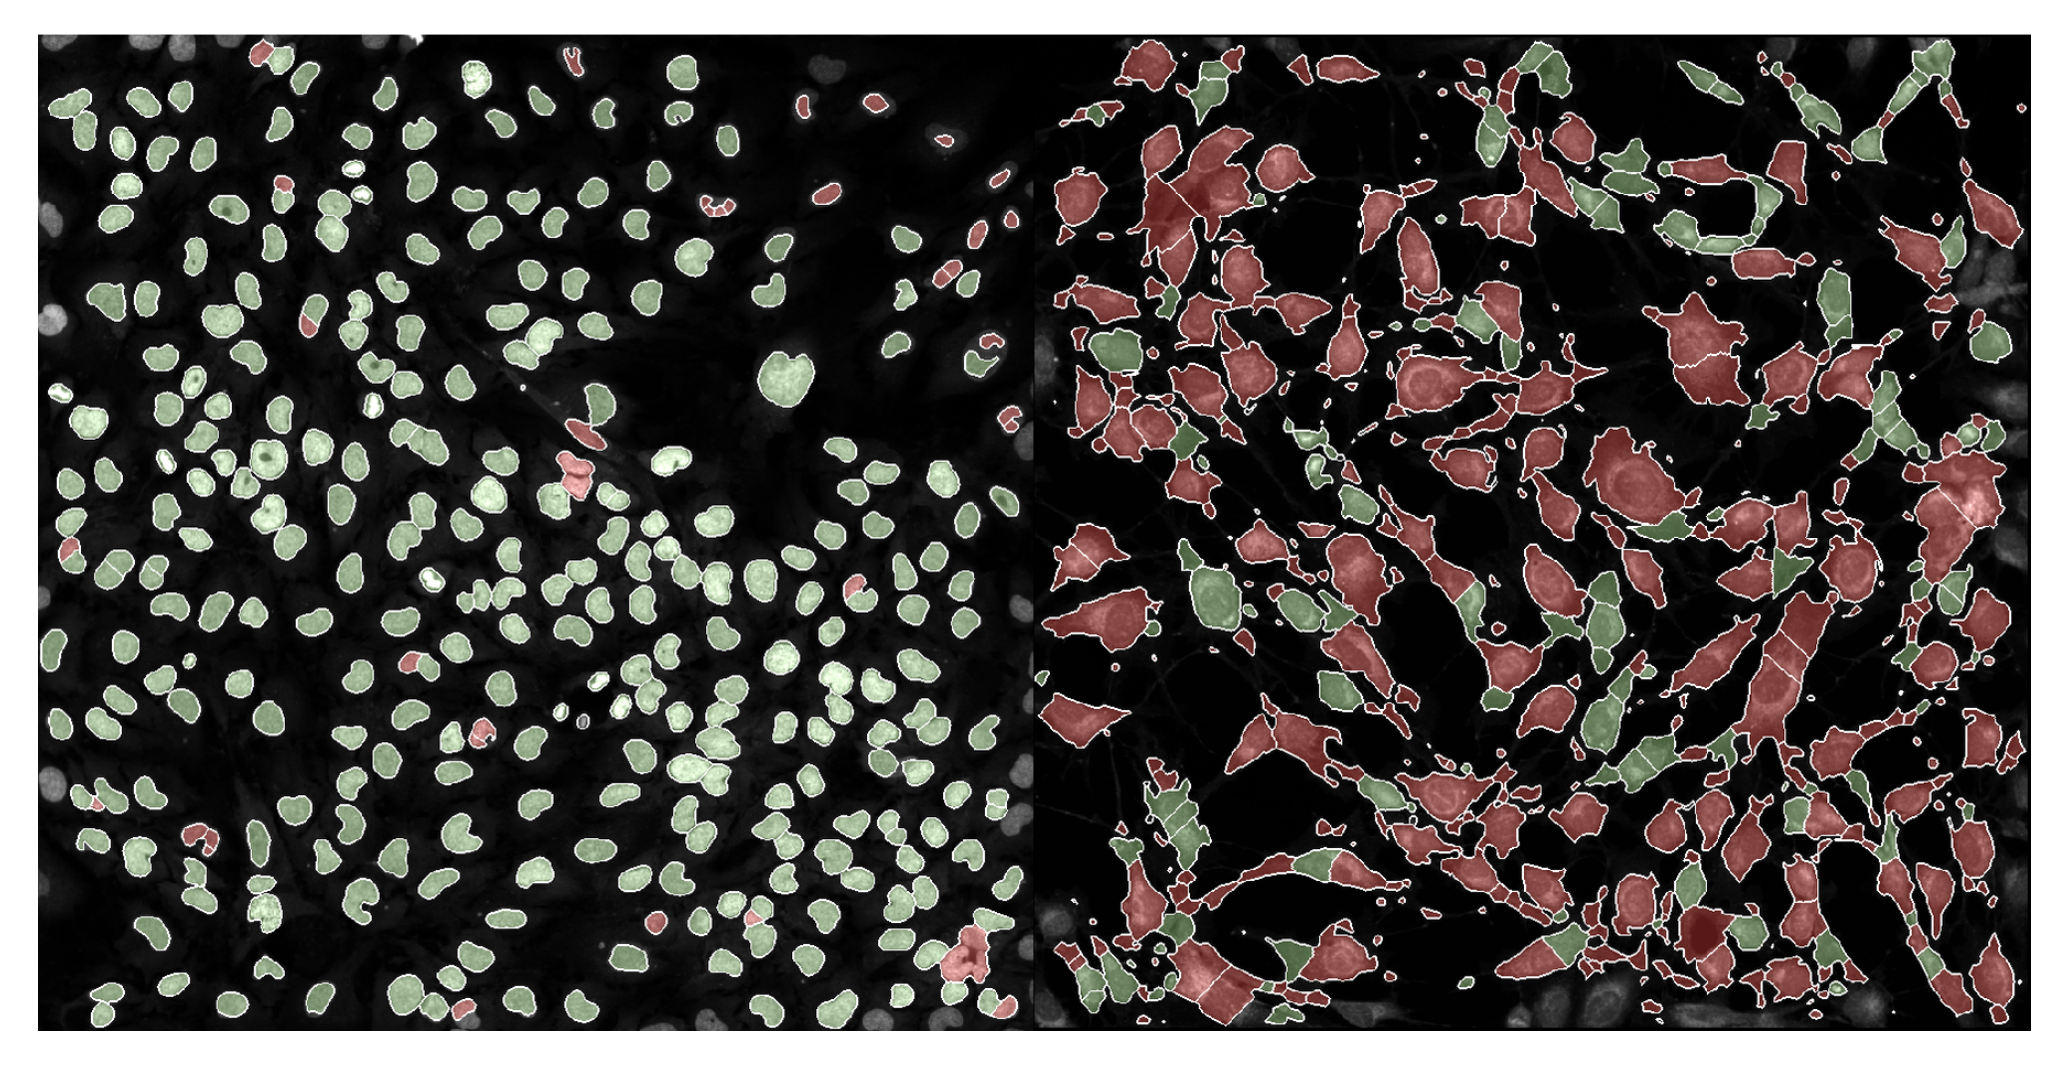
This means that unfortunately, coSMicQC is not robust to some phenotypes and might over-correct the data. But, quality control is not a perfect science. The purpose of quality control, regardless of field, is to maximize the amount of poor quality cell removed while minimizing the amount of good quality cells being wrongly eliminated from the dataset. This means that no matter what, you must expect some false positives, but we can attempt to control for this.
Given that we know the current limitations of the current simple methodology of coSMicQC, we are looking to improve by finding new methods to implement into our software. Some of the current ideas we are thinking of testing include DBSCAN (proposed by Erik Serrano aka @axiomcura) and PCA or UMAP to utilize either all features or selected features to find outliers based on clusters. As well, given the results from Rezvani et al., we might considering incorporating the HBOS method from the PyOD package into coSMicQC.
Our big goal for 2025 is publish a paper for coSMicQC, which means we will be testing on more datasets. We plan on updating this blog with more sections that include the results from evaluating on more data, so please look out for more!
Final thoughts
If you have gotten to the end of this blog and have an idea that you want to propose, please feel free to add an issue to the coSMicQC GitHub! We would really like to make a push towards standardizing this process within the traditional image-based profiling workflow. We hope to build a community around single cell quality control for morphology profiles, so we can lead the field to a future with higher-quality datasets.
Thank you for reading, and happy profiling! 👩🏻💻
Acknowledgements
Thank you to the Way Lab for their unwavering support! A special thanks to Dave Bunten for his direct contributions to the software behind coSMicQC and dedication to improving data quality and standardization! I would also like to thank Erik Serrano for his valuable contributions to the repository, specifically in documenting innovative ideas to advance the software and the process of single-cell quality control!
Figures were either generated in Excalidraw using emojis derived mainly from Google’s emoji combiner tool. One emoji was derived from AI Emoji Generator (stage and curtains).
